Developing our analytical framework
ProjectView: Better planning through shared data
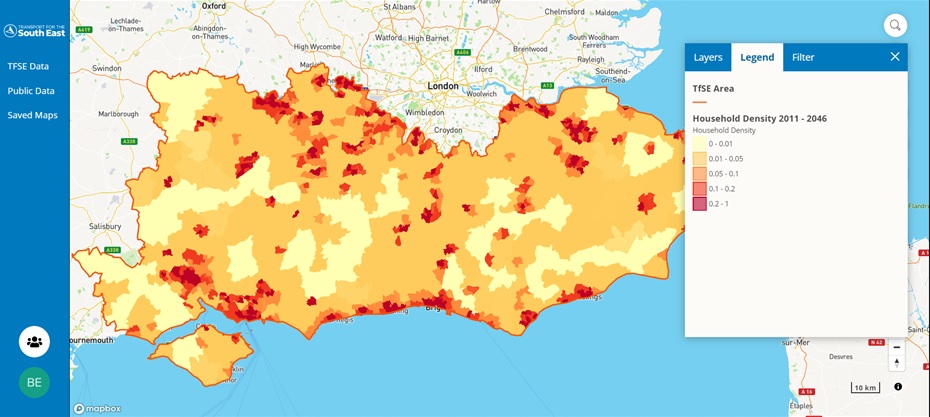
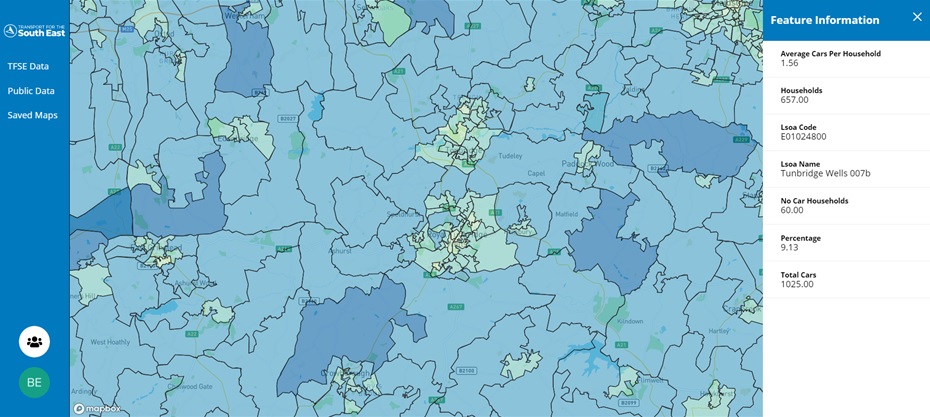
To support our work and to help make sure that investment decisions across the South East are based on common and consistent information, we’ve worked with expert transport consultants WSP to create a bespoke interactive data viewing tool called ProjectView.
ProjectView currently contains 300 different data layers, including more than 100 which were developed as part of Transport for the South East’s transport strategy. The data includes a huge range of economic, social and environmental indicators, plus key information such as planned housing developments, local air quality hotspots, journey times and traffic congestion.
It allows local government officers to create and develop bespoke maps of their area using their chosen data layers, enabling them to present easy-to-view supporting evidence for schemes, projects and other initiatives.
Get involved
We’ve worked closely with our local government partners to develop ProjectView and are currently rolling it out to officers through a series of training workshops.
If you work in local government and would like to know more about how ProjectView can help you, please get in touch.